
AI Model Cost vs. Intelligence: Why the Next Point Gets More Expensive
The economically relevant question isn’t how much a million tokens cost – it’s how much you pay for another point of useful AI capability. Here’s what the data shows.

TL;DR
AI procurement has a pricing problem that has nothing to do with the price list. Buyers compare models on cost per million tokens, but a token is not a unit of intelligence – it is a unit of output. A million tokens from Claude Opus 5 and a million tokens from a small efficient model are not the same product. The economically meaningful question is how much capability you receive per dollar of spend. When you look at it that way, the AI market has a clear structure: moving from weak to capable models is affordable, but the final few points before the frontier can cost 8 to 10 times more per capability point than the tier below. That gap is the Frontier Intelligence Premium. Efficient open-weight models – GLM-5.3-Flash being the current clearest example – periodically collapse it. And organizations that separate intelligence consumption from per-token API pricing change the economics entirely.
What is the AI intelligence cost curve?
The AI intelligence cost curve describes the relationship between the capability of an AI model and the economic cost of consuming that capability.
The definition is simple. The implications are not.
Every AI buyer eventually asks what model to use for a given workload. The default answer – use whatever costs the least per million tokens – is wrong. It conflates the price of quantity with the price of quality.
Two models with identical token prices may produce vastly different economic results depending on how much work each token does. A model that answers correctly in 200 tokens on the first attempt is more valuable than one that takes 600 tokens and requires verification. A model that can execute a multi-step agentic coding task without failure delivers economic value that a weaker model cannot approximate regardless of its per-token rate.
This is why tokens are a poor unit for measuring AI intelligence. They measure output volume. They do not measure output quality.
The intelligence cost curve instead plots capability on one axis and cost per useful task on the other. Artificial Analysisprovides the most consistent publicly available dataset for this. Their Intelligence Index v4.1.1 is a composite of nine evaluations: agentic real-world tasks, banking tool-use, terminal/coding benchmarks, scientific reasoning, general knowledge, and hallucination rate. The resulting score is expressed on a 0-100+ scale. Separately, Artificial Analysis calculates a cost per Intelligence Index task – the weighted average price to complete one full evaluation run across all nine components.
This is the unit that matters. Not price per token. Price per capability delivered.
The curve that emerges when you plot these across models is not smooth or linear. It has discontinuities, Pareto-efficient clusters, and one structural feature that should change how your engineering team thinks about AI budgets: the marginal cost of intelligence rises sharply as you approach the frontier.
Tokens are a poor unit for pricing intelligence
This point deserves its own section because it is counterintuitive to buyers who have spent years managing API costs.
Demirer, Fradkin, and Tadelis (2026) published the most rigorous empirical analysis of AI model pricing to date in the Journal of Economic Perspectives. Their core finding: the quality-adjusted price of AI intelligence fell roughly 1,000-fold between late 2023 and late 2025 – from approximately $30 per million tokens to $0.03 per million tokens, measured against the same level of intelligence.
That number needs unpacking. The raw token price did not fall 1,000 times. What fell was the cost of obtaining a consistent level of capability. In 2023, achieving frontier-level performance on complex tasks required paying $30/MTok. By late 2025, the same performance was available at $0.03/MTok from competing open-weight models and aggressive commercial pricing.
This is precisely the insight from hedonic price indices. The challenge in pricing AI over time is that the product keeps changing. A token from 2023 GPT-3.5 and a token from 2026 Claude Opus 5 are not comparable goods – the latter is orders of magnitude more intelligent. Seagraves and Sirmans (2026) approach this directly, proposing a quality-adjusted index that holds capability constant when measuring price changes. Their work formalizes what is obvious to any buyer who has been in the market for more than a year: tokens measure quantity; they do not measure quality.
The practical consequence: a token-per-dollar budget optimization will systematically make the wrong trade-off. It will send workloads to cheap, weak models when the task requires real capability, and it will overspend on expensive, powerful models when the task does not.
The right framework buys units of intelligence. The intelligence cost curve gives you the map.
The Frontier Intelligence Premium
The data below uses Artificial Analysis Intelligence Index v4.1.1, evaluated across models as of late August 2026. The “cost per task” column is Artificial Analysis’s own metric – the weighted average USD cost to complete one full Intelligence Index evaluation run, including all input, output, cache, and reasoning token charges.
| Model | Intelligence Index | Cost per task | Open weight? |
|---|---|---|---|
| Claude Opus 5 (max) | 63 | $3.25 | No |
| GPT-5.6 Sol | 61 | ~$2.50 | No |
| Grok 4.6 | 61 | ~$1.00 | No |
| Kimi K3 | 60 | ~$0.40 | Yes |
| GLM-5.3 | 60 | ~$0.30 | Yes |
| Qwen3.8 A95B | 58 | ~$0.20 | Yes |
| GLM-5.3-Flash | 57 | $0.09 | Yes (MIT) |
| Mid-tier open models (approx. range) | 45-52 | $0.03-0.08 | Yes |
| Small efficient models (approx. range) | 35-42 | $0.02-0.04 | Yes |
Source: Artificial Analysis Intelligence Index v4.1.1 as of August 2026. Mid-tier and small model ranges are approximate from the Artificial Analysis dataset of 625+ models.
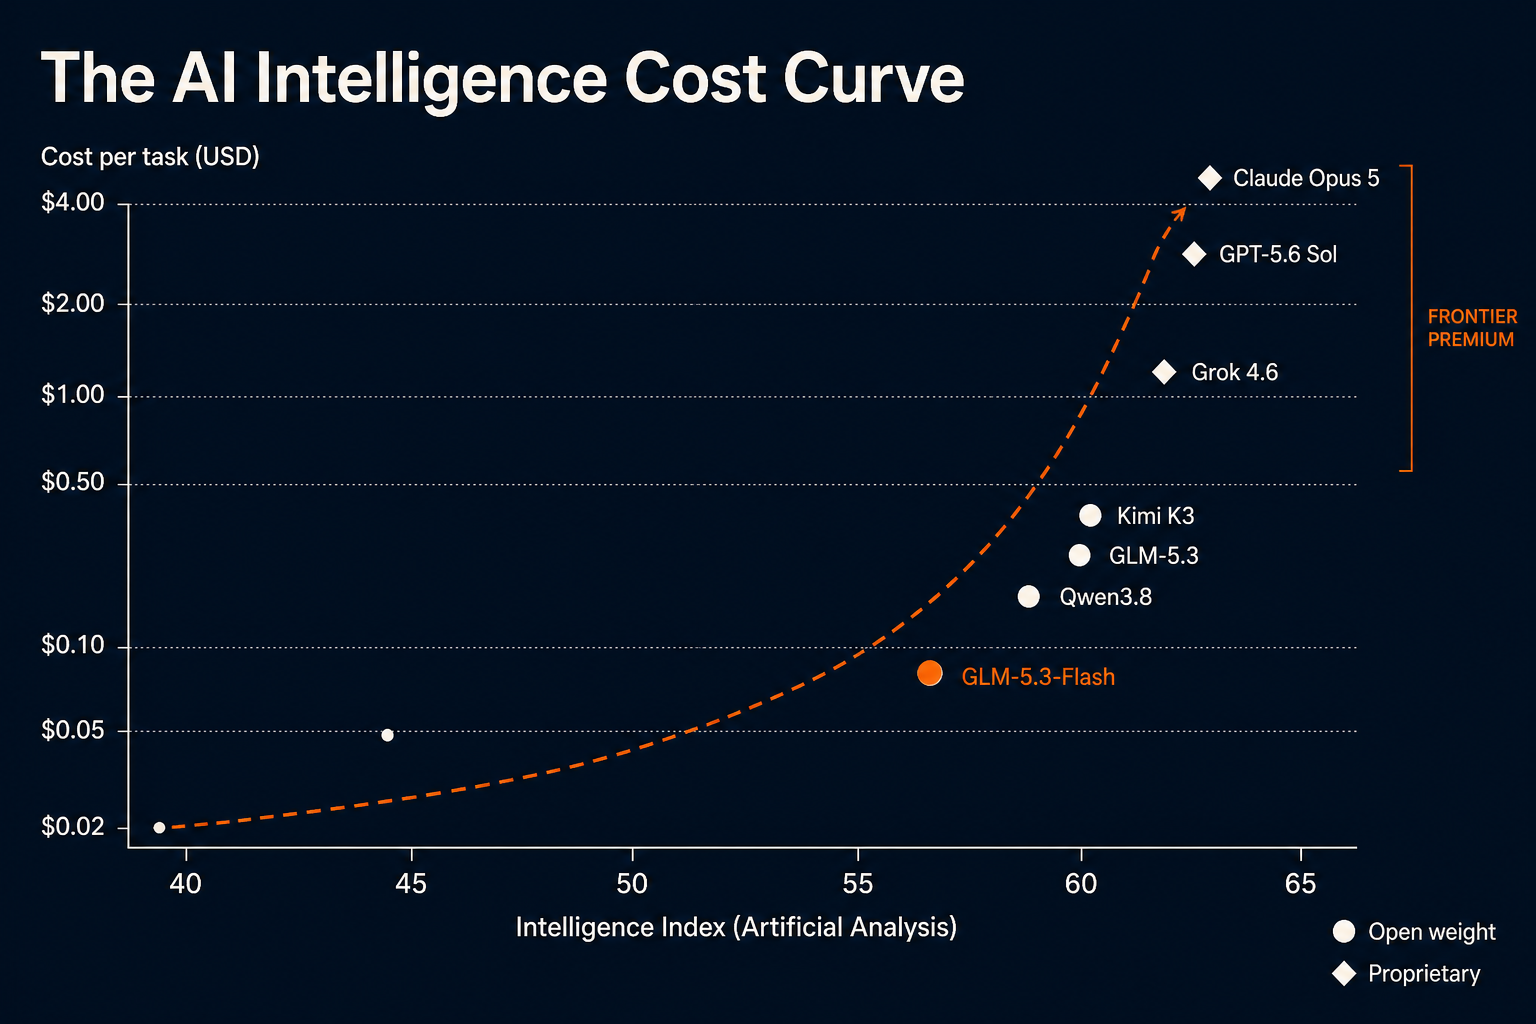
Several things are immediately visible from this dataset.
First, models are not spread evenly across the cost axis. There is a cluster at score 60 with a cost range of $0.20 to $0.40 per task. Then there is a gap, and the next cluster sits at scores 61 to 63 at $1.00 to $3.25 per task.
Second, the efficient frontier is not a smooth curve. A model is economically dominated when another model is both more intelligent and cheaper. The models that matter for purchasing decisions are the ones that are NOT dominated – the set where you genuinely have to trade off intelligence against cost. Along that frontier, the cost of moving from score 60 to score 63 works out to roughly $0.78 to $1.28 per additional intelligence point. The cost of moving from score 45 to score 57 works out to roughly $0.006 per point. That difference in marginal cost – the price of the next capability point – is roughly 100 to 200 times higher at the frontier than at the middle of the distribution.
That is the Frontier Intelligence Premium.
“No other major technology has seen its quality-adjusted price fall so quickly.”
The practical question this creates for every CTO: does your workload actually need those final three points of intelligence, or is it paying the premium unnecessarily?
Where the intelligence cost curve breaks
The curve described above is a snapshot, not a law of physics.
The price/capability frontier shifts whenever the efficiency of a model improves faster than the prevailing cost structure. This has happened repeatedly since 2022, and it is happening faster now.
The mechanisms are architectural. Mixture-of-Experts (MoE) design activates only a fraction of a model’s parameters per inference pass. Where a dense 70B model must compute across all 70 billion parameters for every token, a 320B MoE model with 18B active parameters computes across only 18 billion – at meaningfully lower cost. GLM-5.3-Flash’s hybrid linear and sparse attention reduces attention compute by 3x and the KV cache by 4.4x compared to its non-Flash predecessor. Kimi K2.7 Code’s MoE architecture activates 32 billion of its 1 trillion total parameters. The intelligence-per-compute ratio of these models is genuinely higher than their predecessors.
Training improvements compound this. Better data curation, better pre-training curricula, and self-evaluation during training all improve the quality achievable at a given parameter count. The result: each generation of open-weight models achieves what previously required a model several times larger.
Competition does the rest. Once an open-weight model is released, any organization with GPUs can serve it. Mart Demirer documented the effect empirically: popular open-weight models on OpenRouter are available from 12 or more competing providers. Closed-source models are available from 1 to 3 providers. The inference price for an open-weight model at a given intelligence level is structurally lower, because margin compression from competition is structural.
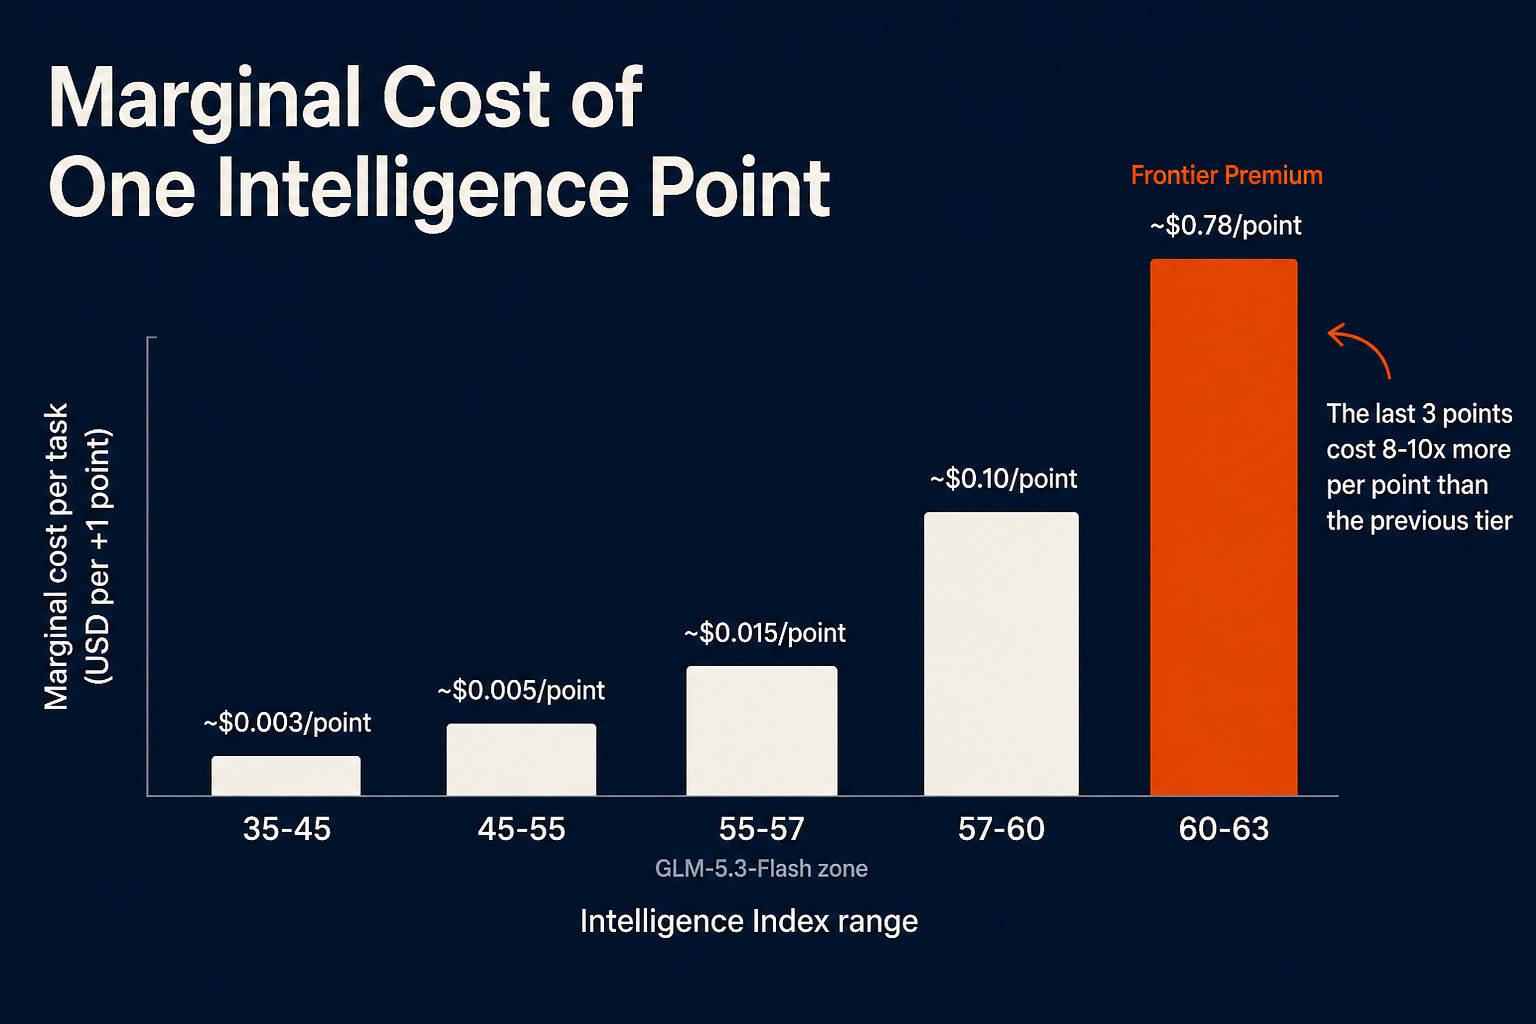
What this means in practice: the Frontier Intelligence Premium is not permanent. It exists because frontier capabilities are not yet available in open-weight form. When a new open-weight model reaches scores that previously required proprietary frontier access, the curve shifts down. That shift does not happen gradually. It tends to happen as a step change – the release of a specific model that suddenly makes a previously expensive intelligence tier accessible at a fraction of the cost.
GLM-5.3-Flash is the most recent clear example of that step change.
GLM-5.3-Flash and the collapse of the intelligence premium
Released on August 26, 2026 by Zhipu AI (Z.ai), GLM-5.3-Flash is a 320B total parameter / 18B active parameter Mixture-of-Experts model with a 1M-token context window, MIT license, and weights publicly available on Hugging Face from day one.
Artificial Analysis scores it at 57 on the Intelligence Index – placing it 4th out of 111 comparable models. The median score for open-weight models of similar size is 29. The cost: $0.09 per Intelligence Index task at standard API pricing via Z.ai, or $0.045 per task at discounted rates. The input price is $0.15 per million tokens; the output price is $0.50 per million tokens.
To understand why this is economically significant, the comparison that matters is not GLM-5.3-Flash vs. small cheap models. It is GLM-5.3-Flash vs. the models that previously occupied the intelligence-57 tier.
Before this release, achieving an Intelligence Index score of 55 to 57 on complex agentic and coding tasks required proprietary models pricing their tokens at $1.00 to $3.25 per task – roughly 10 to 36 times the cost of GLM-5.3-Flash. The model provides frontier-grade agentic coding capability at the price previously associated with mid-tier performance.
On Z.ai’s internal benchmark DeepSWE v1.1, GLM-5.3-Flash scores 63.4. Claude Opus 4.8 scores 58.0. On Terminal-Bench v2.1, the gap is 84.3 (GLM) versus 85.0 (Opus). On AutomationBench, GLM-5.3-Flash scores 48.8 versus Opus 4.8’s 41.0. These are not rounding errors – they represent a model that matches or exceeds a leading proprietary product on the tasks most relevant to enterprise AI workloads, at approximately one-tenth the per-task cost.
The architecture is the reason. By combining linear attention with sparse attention and halving the number of layersrelative to GLM-5.3, Zhipu has achieved 3x lower attention compute with a 4.4x smaller KV cache. The model was also validated before launch under the alias “Ox-Alpha” on OpenCode and OpenRouter – where it became the most-used model of the week, running entirely on Chinese AI chips rather than NVIDIA GPUs. That proof of non-NVIDIA inference is a separate signal worth noting: frontier-grade performance is no longer exclusive to one hardware vendor’s stack.
What GLM-5.3-Flash does to the intelligence cost curve is not subtle. It is a downward displacement of the Pareto-efficient frontier at the score-55-to-57 tier. Organizations that were previously paying $1.00 to $3.25 per task for that capability level can now access it for $0.09. The premium has collapsed at that tier.
The premium has not collapsed at scores 61 to 63. That is the current frontier, and it currently has no open-weight equivalent.
Kimi K2.7 Code: open weights change more than API pricing
Kimi K2.7 Code, released by Moonshot AI in June 2026, makes a different economic argument than GLM-5.3-Flash. Understanding the distinction is important for anyone thinking about AI infrastructure over a multi-year horizon.
The architecture is aggressive: 1 trillion total parameters, 32 billion activated per token, Mixture-of-Experts design, 256K token context window, MoonViT vision encoder at 400M parameters. It achieves roughly 30% fewer thinking tokens than its predecessor Kimi K2.6 – a meaningful operational efficiency gain in a model that already uses interleaved thinking for parallel reasoning and tool use.
On coding benchmarks, the numbers are strong. Kimi Code Bench v2: 62.0 versus 50.9 for K2.6 – a 21.8% improvement. Program Bench: 53.6, up 11% from K2.6. MCP Atlas (tool use): 76.0. These scores compete with GPT-5.5 and Claude Opus 4.8 on the tasks the model is optimized for – agentic coding with multi-step tool use.
Here is where the economic argument requires precision: Kimi K2.7 Code is not automatically cheaper than proprietary models because it has open weights.
The official Moonshot API pricing is $0.95 per million input tokens and $4.00 per million output tokens. Third-party providers offer it from $0.57 per million tokens (DeepInfra) to $1.25 per million (Nebius). At the Moonshot API price, K2.7 Code costs more per token than several competing proprietary models, not less. The hosted version of an open-weight model is not free – it carries the inference cost of a very large MoE model plus provider margins.
What open weights actually provide is an option. When K2.7 Code is accessed via a third-party API, the cost structure is similar to any commercial API. When the same model is deployed on infrastructure the organization controls, the per-token retail margin disappears. What remains is the actual compute cost: GPU hours, electricity, engineering, and hardware depreciation.
For most organizations, that compute cost is lower than the API retail price at meaningful scale. The open-weight model does not provide free intelligence – it provides the option to produce intelligence at marginal cost rather than retail price. That is a different economic structure, and at sufficient volume, it is a substantially better one.
The model also supports INT4 quantization and runs on vLLM, SGLang, and KTransformers, lowering the hardware requirement for deployment. The Modified MIT license permits commercial use.
Kimi K2.7 Code is interesting not because it offers the cheapest API endpoint – at the Moonshot price, it doesn’t. It is interesting because the existence of open weights means the API price is not the ceiling on what the model’s intelligence costs. It is only the current retail price, which competition and self-hosting can undercut.
Open models shift the curve down
The empirical evidence for this is now in the peer-reviewed literature.
Demirer, Fradkin, and Tadelis (2026) analyzed pricing data from OpenRouter across January to December 2025, covering 668 models from 88 creators. Their finding on open-versus-closed pricing is stark: open-source models cost approximately 90% less than comparable closed-source models at equivalent intelligence levels.
The mechanism is structural. Closed-source models are available from 1 to 3 providers. Popular open-weight models are available from 12 or more competing providers simultaneously. The inference provider market tripled in size from November 2024 to December 2025 – from 27 providers to 90 – driven almost entirely by organizations hosting open-weight models. When 12 providers are competing on price for the same model, margin compression is not optional.
The broader consequence is an ongoing downward shift in the quality-adjusted price of intelligence. The Demirer et al. 1,000-fold decline figure reflects this: it is not that any single model got 1,000 times cheaper. It is that the same level of intelligence that cost $30/MTok in 2023 was available for $0.03/MTok by late 2025, because better models had been released at each capability tier, and open-weight competition had driven prices toward marginal compute cost.
The models that produce this effect are not exclusively small or medium-capability. GLM-5.3 (the full non-Flash version) scores 60 on the Artificial Analysis Intelligence Index – matching Kimi K3 and comparable to proprietary models that cost several times as much per task. Kimi K3 itself placed third overall among all evaluated models, open and proprietary, on the Intelligence Index – while costing roughly 80% less per task than the proprietary models clustered around the same score.
The pressure on the Frontier Intelligence Premium is therefore predictable, even if the timing is not. Each generation of open-weight models closes the capability gap with the proprietary frontier. When that gap closes at a given tier, the premium at that tier collapses.
The residual premium exists where open-weight models have not yet reached. Currently, that is scores 61 and above. The question is how long that exclusivity holds.
Renting intelligence vs. owning the machine
Understanding the intelligence cost curve creates a practical decision: where on the curve should a given workload sit, and how should the underlying inference be provisioned?
These are two separate questions. The first is about model selection. The second is about cost structure.
When intelligence is acquired through a commercial API – whether the model behind it is open or proprietary – every unit of intelligence incurs a variable charge. More tokens in, more tokens out, more cost. The P&L is exposed to usage volume, price changes by the provider, and the absence of any residual value from past spending. Nothing accumulates.
When intelligence is produced on infrastructure the organization controls, the cost structure changes. Hardware, electricity, network, and engineering are real costs that do not disappear. The per-token retail margin does disappear, because there is no third party extracting it. At low volumes, the API is almost always cheaper – the fixed costs of infrastructure are not justified by the variable savings. At high volumes, the math inverts.
We went through this calculation in detail in our article on AI token price versus infrastructure cost. The threshold depends on your specific models, provider prices, and utilization, but the structural logic is consistent: the per-unit economics of ownership improve as volume grows, and the per-unit economics of API rental stay roughly constant or worsen.
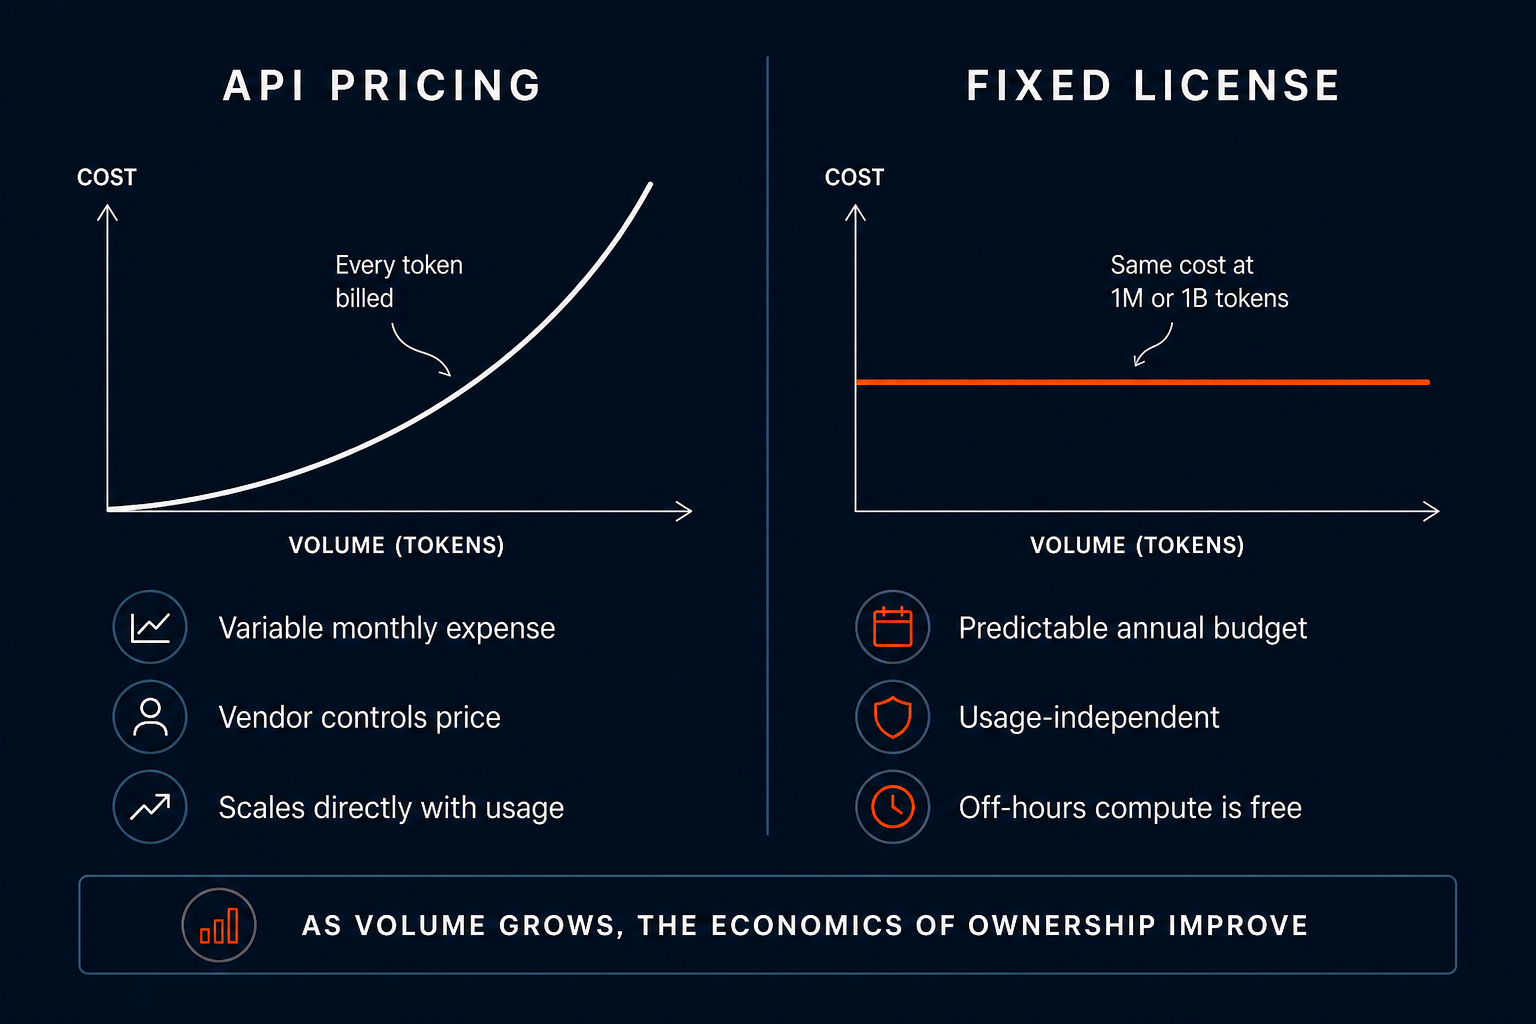
There is an additional dimension worth naming: time. API pricing is not set by the laws of physics. It is set by providers who are optimizing for revenue. That price can increase if competitive dynamics change, if usage patterns shift, or if a provider reassesses their cost structure. Infrastructure you own does not carry that risk. The cost of electricity, hardware, and engineering is far more predictable over a five-year horizon than the cost of a provider’s API.
The open-weight model question fits here. Kimi K2.7 Code at Moonshot’s API price of $0.95/$4.00 per million tokensis a retail price. The same model on a DiscreteStack node running at fixed cost per year – with hardware-optimized serving, 90%+ cache hit rates, and no per-token billing – converts from a variable line item to a fixed one. The intelligence is the same. The accounting treatment and the long-run unit economics are entirely different.
How much intelligence should you actually buy?
The intelligence cost curve is useful as an analytical framework. It is most useful as a purchasing decision tool.
Most enterprise AI workloads do not have uniform intelligence requirements. A first-pass triage of incoming support requests does not need a score-63 model. A legal contract review that has material financial consequences might. An internal search index serving 200 employees with structured queries is a different economic animal than an autonomous coding agent writing production infrastructure.
The decision framework has five questions.
What intelligence level does this workload actually require? Not the maximum available – the minimum sufficient. Most workflows can be evaluated on a sample of real inputs to measure quality degradation as you move down the capability scale.
What is the measurable quality improvement from the next model tier? Moving from a score-57 to a score-60 model typically improves benchmark performance by 3 to 10 percentage points on complex tasks. Moving from score-60 to score-63 might add another 3 to 5 percentage points on benchmarks, at 8 to 10 times the per-task cost. Whether that improvement is worth the premium depends entirely on what the task is worth.
What is the marginal cost of that improvement? The table above is a useful starting point. A cleaner calculation: run both models on a representative sample of your actual workload and measure cost and quality directly. Benchmark index comparisons are proxies; your specific task distribution may differ.
Does every request need the same intelligence level? Almost certainly not. The economically optimal stack routes tasks based on their requirements. Simple requests to an efficient model at score 45 to 57. Complex, high-stakes requests to a frontier model at score 61 to 63. A routing layer that classifies request complexity before dispatch can dramatically reduce blended cost without measurably reducing quality.
At what volume does infrastructure ownership outperform API rental? This calculation is covered in our token price versus cost article. But the input variables are now clearer: the intelligence level you need, the API price for that intelligence level, and the fixed cost of operating equivalent infrastructure.
The economically optimal AI stack is unlikely to use maximum intelligence for every token. It allocates intelligence according to the value of the task. The Frontier Intelligence Premium is not universally worth paying – but for the workloads where it is, it is worth paying without compromise.
The price of intelligence is falling – the frontier is different
Two things are simultaneously true, and the tension between them is the central fact of AI model procurement right now.
First: the quality-adjusted price of intelligence has collapsed. From roughly $30 per million tokens in late 2023 to $0.03 by late 2025 – a 1,000-fold reduction in under two years. GLM-5.3-Flash at $0.09 per Intelligence Index task delivers capability that two years ago required frontier proprietary models at hundreds of times that price. For most enterprise workloads, the per-unit cost of AI intelligence has become a secondary concern.
Second: the final few points at the frontier still command a substantial premium. Claude Opus 5 at score 63 costs $3.25 per task. The best open-weight models currently reach score 60. That 3-point gap costs roughly $0.85 to $3.00 per task to close, depending on the open-weight baseline. For tasks where score 63 is genuinely necessary, that cost is not avoidable with currently available models.
The pattern from here is predictable. Efficient open-weight models will periodically close the capability gap with the current frontier. When they do, the premium at that tier collapses and rebuilds a few points higher. The frontier moves, and open competition follows.
The long-run shift that matters most is not which model wins at any given moment. It is the structural move from paying retail prices for individual tokens toward operating the infrastructure that produces intelligence on fixed-cost terms. That shift is available now, at the capability levels that cover the vast majority of enterprise workloads. It does not require waiting for open-weight models to match the absolute frontier.
Try DiscreteStack
DiscreteStack builds private AI infrastructure for enterprises that want to separate their AI spending from per-token variable pricing. Our nodes run on NVIDIA hardware and currently ship with Kimi K2.7 – the open-weight model at the top of the coding and agentic intelligence tier – along with Ornith-1.0 for extended context. The license is flat: no token metering, no per-request charges.
At that price, a production node serving a 50-person power-user team works out to €0.24 per million tokens, against €1.30 on hyperscaler APIs – an 82% reduction in per-token cost, with the additional benefit that off-hours compute incurs no marginal charge at all. The intelligence is the same. The cost structure is not.
Shared access is available in 24 hours. On-premise deployment takes approximately one week. DiscreteStack private AI infrastructure – one server, open models, flat annual license, as taken from DiscreteStack
If the intelligence cost curve analysis above suggests your workloads are paying a premium they do not need to pay, the comparison page will give you a concrete number for your specific case.